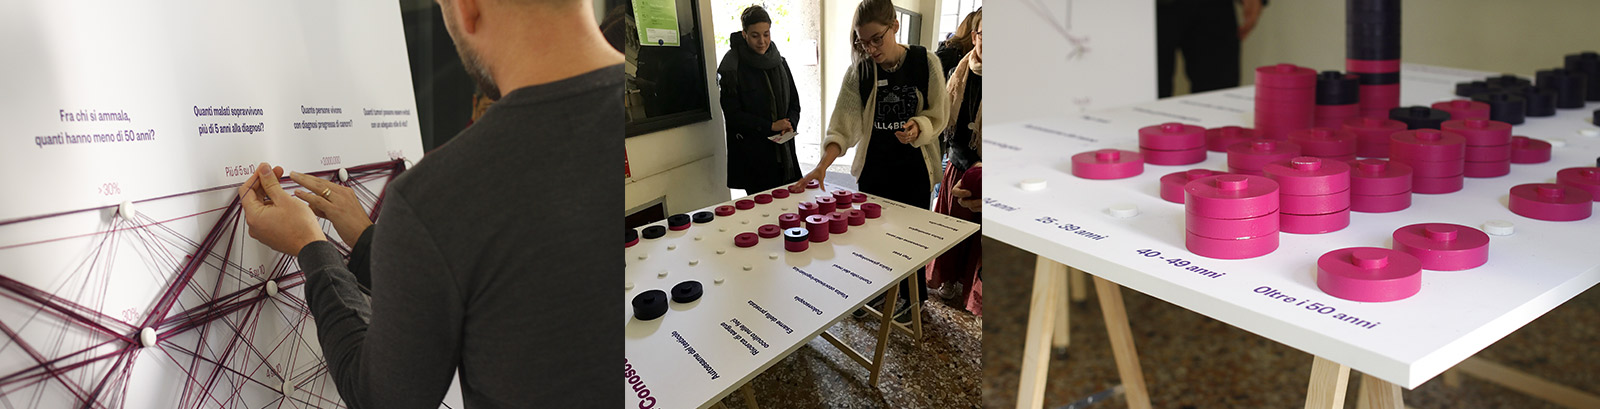

Participatory Diagrams© were created to inform and train small local communities on cancer figures and good prevention practices, with a new approach: physical - that is, tangible and perceptible through senses - and playful. They integrate the visualization of data with physical interaction with the public. The physical representation of the data allows people to interact with figures such as the incidence of cancer and survival rates which, if only read or listened to, are often not fully understood and internalized. An active, experiential and shared learning methodology that successfully copes with the need to find new languages to significantly expand the culture of prevention and achieve new collective awareness objectives.
Participatory experience is developed through 2 diagrams:
Recently, the Participatory Diagrams© were chosen as an awareness tool in the prevention and health events by the European Commission's Joint Research Center, which produced a tailored version presented for the first time in a public meeting in May 2019.